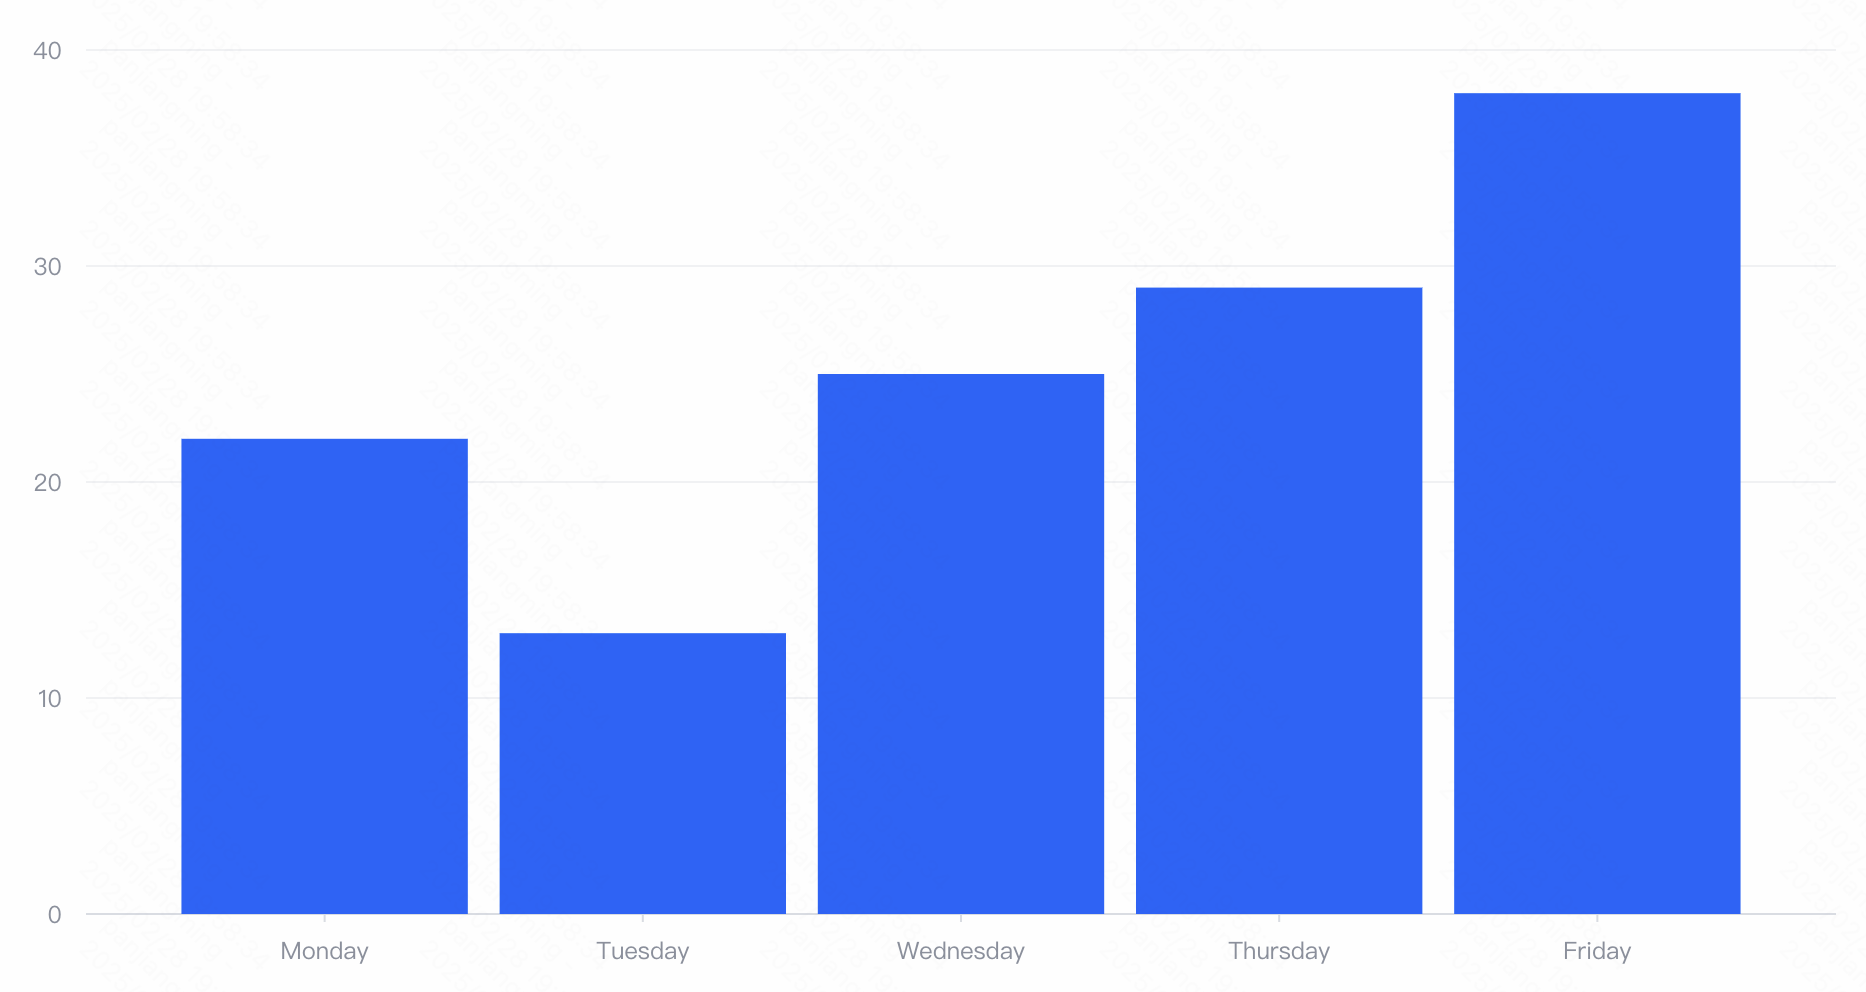
通过封装 VChart 组件,实现简单易用的图表。达到代码复用,提高研发效率。
最近有一个需求,需要实现一个图表,图表的数据是动态的,需要根据后端返回的数据进行实时更新。
在调研了 ECharts 后,发现 ECharts 的使用门槛较高,需要对 ECharts 的 API 有一定的了解。同时关注到了 VChart,VChart 的使用门槛较低,只需要对 VChart 的 API 有一定的了解即可。同时对 VChart 的文档进行了调研,发现 VChart 的文档非常详细,可以满足我们的需求。
当然,并不是说 VChart 就完美无缺,VChart 的文档虽然详细,但是对于一些特殊的场景,VChart 的文档并没有给出详细的说明。比如,如何实现动态数据更新,如何实现图表的交互等。因此需要我们对 VChart 进行二次封装,以满足我们的需求。
前置知识
快速上手 VChart
VChart 封装
components/VChart.vue
 1
 2
 3
 4
 5
 6
 7
 8
 9
10
11
12
13
14
15
16
17
18
19
20
21
22
23
24
25
26
27
28
29
30
31
32
33
34
35
36
37
38
39
40
41
42
43
44
45
46
47
48
49
50
51
52
53
54
55
56
57
58
59
60
61
62
63
64
65
66
67
68
69
| <script setup>
import { onMounted, defineProps, watch } from "vue";
import VChart from "@visactor/vchart";
import { useAppStore } from "@/store";
const appStore = useAppStore();
// 组件接收的 props
const props = defineProps({
// 图表的配置
spec: {
type: Object,
default: () => ({}),
},
width: { type: [String, Number], default: "100%" }, // 图表宽度
height: { type: [String, Number], default: "400px" }, // 图表高度
});
const chartContainer = ref(null);
// 绑定 VChart 实例
let chart;
function createOrUpdateChart() {
console.log("createOrUpdateChart", chartContainer.value);
if (chartContainer.value) {
if (!chart) {
console.log("📌 创建新图表实例", props.spec);
chart = new VChart(props.spec, {
dom: chartContainer.value,
});
} else {
console.log("🔄 更新图表", props.spec);
chart.updateSpec(props.spec);
}
chart.setCurrentTheme(appStore.isDark ? "dark" : "light");
chart.renderSync();
}
}
onMounted(() => {
createOrUpdateChart();
});
onUpdated(() => {
createOrUpdateChart();
});
onBeforeUnmount(() => {
if (chart) {
chart.release();
}
});
// 可选,明暗模式切换
watch(
() => appStore.isDark,
() => {
createOrUpdateChart();
}
);
</script>
<template>
<div
ref="chartContainer"
:style="{ width: props.width, height: props.height }"
></div>
</template>
|
根据代码可知,我们只需要关注 spec 的配置即可,其他的都是自动处理的。
使用
 1
 2
 3
 4
 5
 6
 7
 8
 9
10
11
12
13
14
15
16
17
18
19
20
21
22
23
24
25
26
27
28
29
30
31
32
33
34
35
36
| <template>
<div class="mt-12 flex">
<VChart :spec="spec" />
</div>
</template>
<script setup>
import VChart from '@/components/VChart.vue'
import api from '../api'
const spec = ref({
type: 'bar',
data: [
{
id: 'barData',
values: [
{ month: 'Monday', sales: 22 },
{ month: 'Tuesday', sales: 13 },
{ month: 'Wednesday', sales: 25 },
{ month: 'Thursday', sales: 29 },
{ month: 'Friday', sales: 38 }
]
}
],
xField: 'month',
yField: 'sales'
};)
api.getData().then({ data } => {
spec.value = {
...spec.value,
data: { values: data.freeServerCountBySuit },
}
});
</script>
|
